Medical News Blog Information

Freeze those chickens....

As 8 new H7N9 cases are announced today we see a very welcome comment from Hangzhou City's mayor, Zhang Hongming...
"Hangzhou is planning to close live poultry trading markets permanently and promote the supply chains of frozen poultry products instead"
If Zhejiang Province can carry this off, it would be perhaps the single biggest intervention and risk mitigation step possible. 

Centralising poultry slaughter and providing chickens in a partially prepared and refrigerated/frozen condition could buy the time needed for research to catch up with public health needs. This could include further enhancing farm, market and human screening and finding the feathered or furry fiend(s) acting as the source(s) for these putative zoonotic transmissions (also for H5N1, H7N7, H9N2, H10N8, etc). 

Such change would also radically reduce the chance of selecting more efficiently transmitting human-adapted flu viruses by simply reducing contact between the large numbers of birds (and other animals) and humans occurring on a daily basis in the market environments and through the transport and slaughter of live birds throughout their heavily populated surrounds.

The changes in social behaviour and habits required the Chinese are huge, but such change should be considered as being as great an investment in the future health of the local and global populace as vaccines have proven to be.

Source...
  1. Xinhua
    http://news.xinhuanet.com/english/china/2014-01/27/c_126071190.htm

Influenza H7N9 in the news....

Some snippets of information about H7N9 from China in recent releases include:

  1. The description of H7N9-induced disease has changed in 2014 from an "infectious disease" to a "communicable acute respiratory disease". For what that's worth.
    Still technically infectious, just more about what sort of disease.
  2. 7 patients have died with H7N9 infection in 2014
  3. The incubation period for signs and symptoms to develop after H7N9 infection is 3-4-days; if patients develop severe pneumonia, it will be 3-7-days after signs and symptoms begin
  4. Chinese Vice Premier Liu Yandong said
    "China will strengthen monitoring on live poultry, continue vaccine research and development, tighten international communication and cooperation in epidemic prevention and control, and publicize disease information in a timely manner"
  5. "DNA rapid tests" (PCR-based) suggest a batch of chickens being imported into Hong Kong from Foshan, Guangdong may be H7 positive. H7N9? Further testing is ongoing. [Update - looks like they were POS as Hong Kong has suspended imports and will cull 20,000 chickens already there]
  6. 12 cases in Zhejiang province have died from H7N9 in 2014 alone! I have 2 listed. 7 in total 2014. Looks like we've lost traceability on the numbers again.
Sources...

Zhejiang: more live bird market closures...

FluTrackers have posted a report originating from the Ningbo evening news in China stating that more markets in Zhejiang province, in the regions below, have been closed for cleaning and disinfection in an attempt to bring the Province's H7N9 outbreak under control...

These regions have already suspended trading...
  • Hangzhou city (which I noted here)
  • Xiaoshan District
  • Yuhang District
  • Jinhua
  • Shaoxing City
This new report notes closure of the following markets in the "main city of Ningbo" from 26-Jan..
  • Haishu District
  • Jiangdong District
  • Jiangbei District
  • Yinzhou District
Exotic bird imports and pigeon flying has been banned.

H7N9 Welcome to Week #50....

Media preview
Chart of weekly cases from @influenza_bio

Let's play duelling charts!! My colleague on Twitter, @influenza_bio, (whom you should follow if you are not already - he's got a knack for (a) getting across some nice flu-facts in a easy-to-understand way and (b) he rants - who doesn't like a ranter!?! That sounded less weird in my head.

Today's chart update from me shows the avian influenza A(H7N9) virus weekly and accumulation case chart. In case I haven't mentioned this lately, the human cases of infection by this newly emerged (in humans) virus is all from south eastern China. 

Given that cases keep on coming, this chart has changed a lot in a few days. The last chart is now already 4-days old. Ancient. See it here.


Click on image to enlarge.
My latest chart lists 246 cases and is based on the FluTrackers curated list (to be found, and checked regularly, here) and includes all recent WHO update information which provides some extra details - including date of onset of illness and hospitalization since late October. WHO has a few cases to catch up on.

These are useful additions since cases can be noted in the media or by the relevant ministries or public health institutions many days after the illness manifested in the patient and even after they were admitted to a hospital, usually in pretty poor medical condition. 1 more was added form Jiangsu last night that missed those charts.

I've arbitrarily listed the 2 "Waves" of H7N9 cases - if there is an official designation for dates, I'd be happy to hear of it.

Zhejiang province surpasses 100 avian influenza A(H7N9) cases...

As of tonight's 2 additions, my tally shows Zhejiang province on 101 H7N9 cases, 41.2% of all 245 human infections confirmed to date. The BBC recently noted 55 deaths which would result in a PFC of 22%. This continues the lower trend we've seen in the PFC for a while now; the result of a sharp increase in new cases but few deaths among those.

In reality both the Zhejiang and the total case numbers are very likely a massive underestimate of the actual number of human infections, but until we have any actual lab testing results, we won't know that for sure and can only speculate on what's "out there" based on our experience, extrapolation from other outbreaks, epidemics and pandemics, 60+ years of respiratory virology research and a touch of logic.

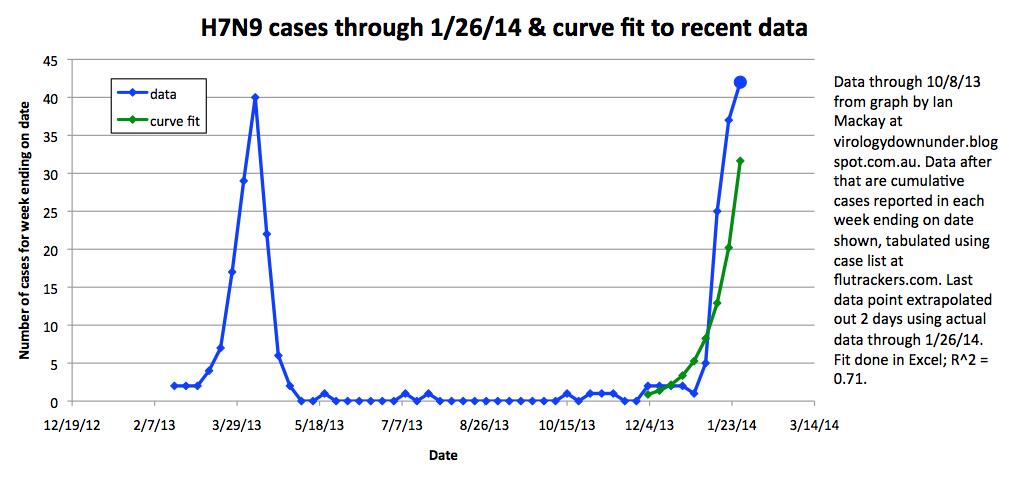
Overall, in the most active of the case acquisition periods of 2013, we saw case numbers rise an fall abruptly...


  • Week 5: 7 cases
  • Week 6: 17 cases
  • Week 7: 29 cases
  • Week 8: 40 cases
  • Week 9: 22 cases
  • Week 10: 6 cases
In 2014 we seem to be right in amongst that now as we (in Australia) see out Week 49..

  • Week 45: 6 cases
  • Week 46: 26 cases
  • Week 4733 cases
  • Week 48: 12 cases
  • Week 49: 17 cases
We are still seeing a few cases with illness onset in Week 47 (6-Jan to 12-Jan) so tat could yet reach Week 8's levels, or more unless the market closure start to show an impact soon.

The return of the H7N9 case chart timeline...

Click on image to enlarge.
Please note, this chart is based on publicly available data and its completeness
suffers accordingly. It is provided as a guide only. Each black line (y-axis;
FluTracker's case numbering is used for comparability) represents a single, laboratory-confirmed
H7N9 patients' journey through time (the bottom, x-axis).  Data on patient discharge dates were
particular patchy in 2013 and I have yet to update what is available onto this chart (please ignore the terminal coloured dots for now)

...and its associated headaches.

This is a chart the really relies on complete data to be of full use.

I just had a look at the 2013 chart...you can find it here... which was last updated 02.06.2013. It's clear from that figure that detail on when H7N9 cases leave hospital was pretty scarce at the end of the first outbreak; or I couldn't find it. There has been a tally described in the past - around 86 cases discharged I think - but which cases is largely unclear.

So you can see that a lot of the 2013 patient's timelines trail off into infinity. By now those ill people would have been discharged or are part of the fatal cases list. Interesting that that link above describes a case that was hospitalized for 67-days, before succumbing.

Today I began the next case timeline chart for 2014. It's still a work in progress as I have yet to trawl through the cases to see which have been described as discharged (some definitely have) and I have not yet included those cases who were not admitted because illness was mild or without any obvious signs of disease at all.

As you can see from the new chart of 82 cases with a date of illness onset of 01-Jan-2014 or later (you'll need to click on it to appreciate the detail), the number of fatal cases, to date, is much lower tan it was in 2013's first wave of H7N9 infections.

It would not be surprising to find that most cases remain hospitalized in 2014 as the majority have been initially described as critical, severe or serious in this second round. I wonder how the contacts of these case are faring?

I will try to flesh this out in the coming weeks. Hopefully we remain as red dot-free as we are now.

Like Us

Blog Archive