Medical News Blog Information

Showing posts with label cases. Show all posts

Tracing the MERS-CoV cases in South Korea...

The Korean Broadcasting System (KBS) News channel has made an awesome "bump map" or force diagram (thanks @Casillic) showing the layout of cases and the hospitals they passed through or were admitted to or transferred to.[1] It shows sex, deaths (9 across multiple facilities), profession, rounds of transmission and some dates (written as month.day)

Unfortunately for some of us, it's in Korean. If you, like me, are having trouble remembering your grade school Korean, I'm here to help (a little).

I've put together a screenshot of this awesome map as of today's count of  - no doubt the values will change tomorrow - and added onto it the hospital names in English. I highly recommend you visit the actual site though - the map is scalable and interactive. This snapshot does not do it justice and won't be updated like the map seems to be.

I've interpreted the hospital names by eye from the Hong Kong Centre for Health Protection's (CHP) excellent multi-lingual list of all the "MERS hospitals" released by the Korean health authority.[2,3] They may not be perfect and I'd be happy to take any suggestions and corrections (including what is in the orange boxes).

The index case, #1, is shown in green and is linked here to 2 clinics and a hospital - which differs a bit from the WHO story which includes a final move..."whereupon he was transferred to the nationally designated treatment facility for isolation".

The most recent additions seem to have a pulsing arrow (only visible at the source).

Made using a combination of sources. [1,2]
Click on image to enlarge.

References...

  1. http://dj.kbs.co.kr/resources/2015-06-04/
  2. http://www.chp.gov.hk/files/pdf/distribution_of_mers_cases_en.pdf
  3. http://www.chp.gov.hk/files/pdf/korean_hospital_list.pdf

A good week for viruses...not so great for humans...

Edited for clarity 25MAY2015
Middle East respiratory syndrome coronavirus (MERS-CoV) managed to get out for some sightseeing - travelling to South Korea this week - and Ebola virus|Makona was given a helping hand to spread to new people in Guinea and Sierra Leone with a small splurge of new confirmed cases.

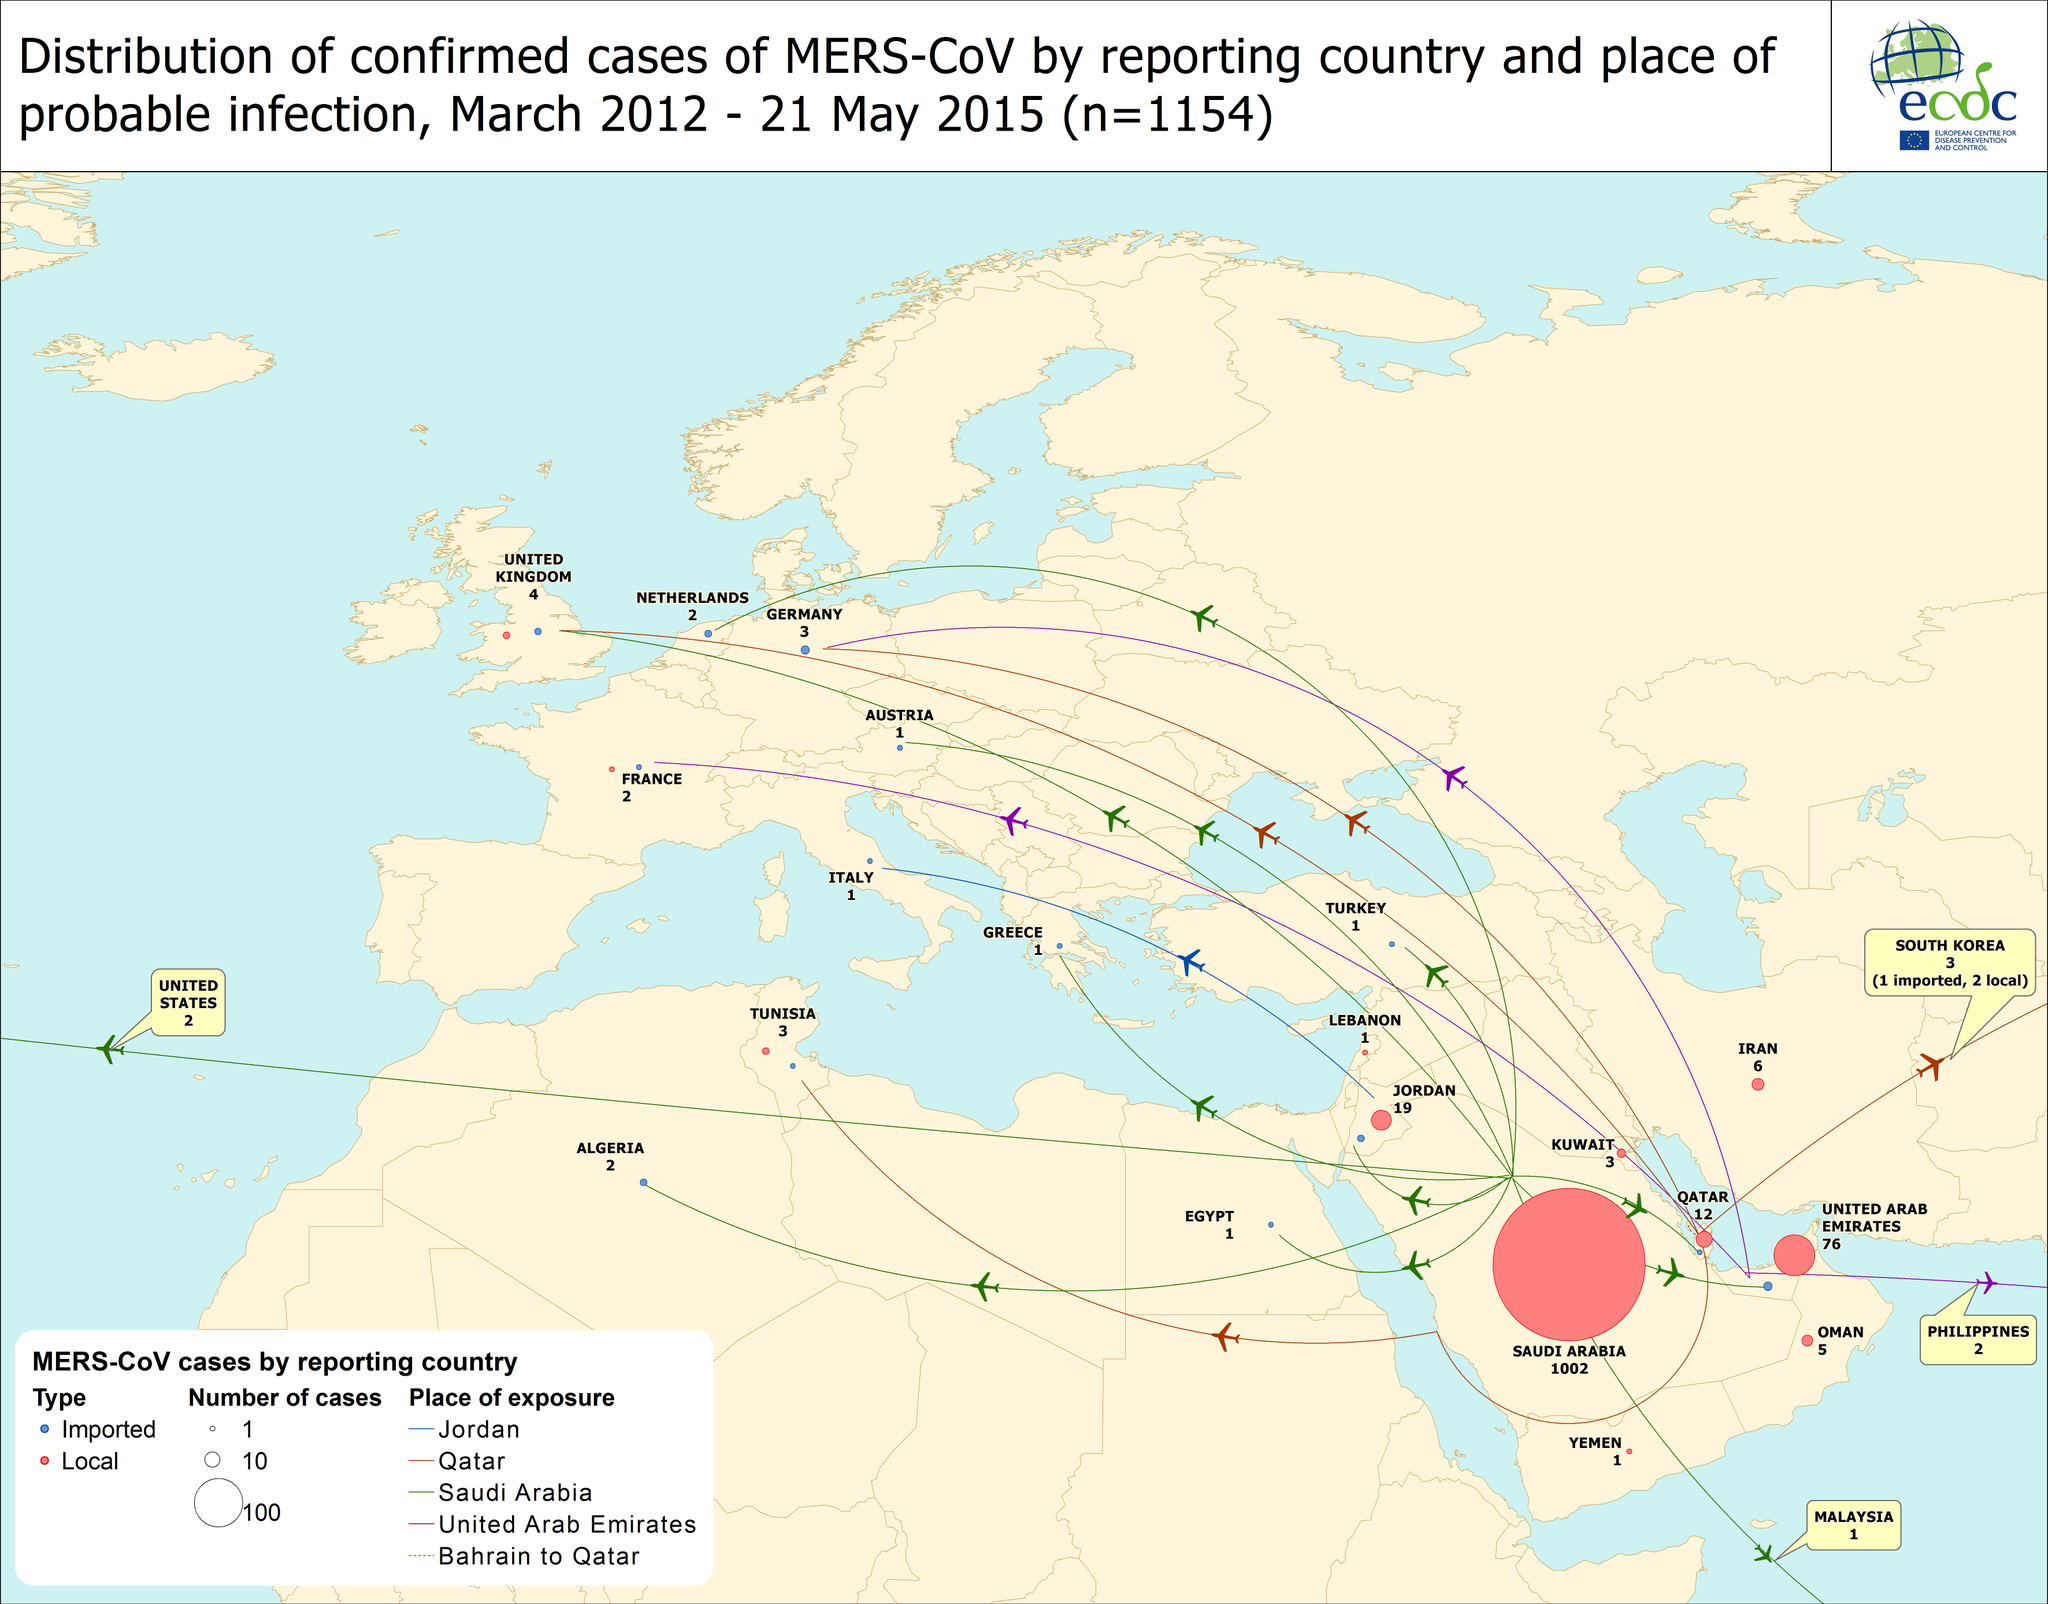
MERS has now trickled into 24 countries world wide as shown in the European Centre for Disease Prevention and Control's (ECDC) epic 'travel-by-plane' map.

Media preview
The original of this is created by the ECDC and is presented here.
Click on image to enlarge.
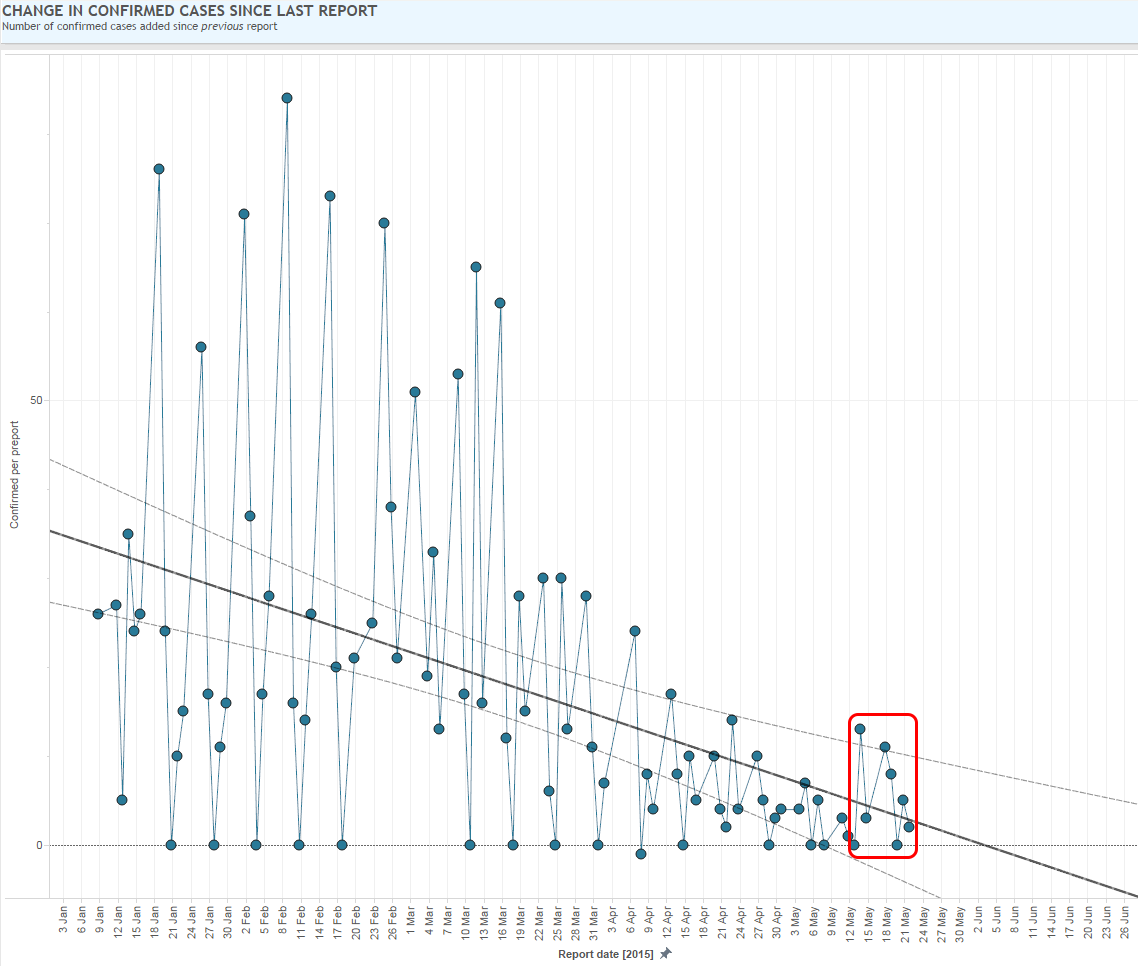
Meanwhile, a crude extrapolation from current Ebola virus disease (EVD) case numbers saw the predicted date when we might reach zero cases, move further into June. 

This could pull back again or it could move further away if the EVD clusters and sporadic cases continue to spread. We can't model that because it's entirely down to unpredictable human variables. We can list what those are, we can better prepare for them, we can educate about them and how to prevent them and we can acknowledge that they are real, but we cannot know when and in what mix they will come into play.

Extrapolation of the public data for confirmed Ebola virus disease cases from
WHO. The most recent week is boxed in red and bucked the trend of declining
 cases. To see how I made this please visit here.
Click on image to enlarge. 
The newest EVD cases remain mostly clustered around the Forecariah prefecture of western Guinea, on the north west border with Sierra Leone but also 5 new cases appeared in the north west of Guinea in Boke prefecture, which borders Guinea-Bissau. 

Geographical distribution of new and total confirmed cases
From the World Health Organization's Ebola virus disease Situation Report, 20MAY2015.
Click on image to enlarge.
Since the last EVD SitRep, two days of reporting have seen fewer cases than in the same two days of the week before. 

So there's that. 

Quickly reporting what is actually happening is invaluable for all sorts of reasons. Modelling and prediction allow us to get ahead of the virus. But having the data, and having them available publicly remains a challenge for every country and for every outbreak. 

Public health data are about the public's health. If it has been considered worth collecting and collating, why not communicate it too?

The weakening pulse of the Ebola monster...

As of this post, some of the most comprehensive publicly available data on an emerging virus is coming out of the Kingdom of Saudi Arabia in relation to the Middle East respiratory syndrome coronavirus (MERS-CoV). Yeah-that's what I said. Even with all the issues I complain about, its more detailed than for other current outbreaks. 

In 2015, China became a major disappointment in its poor publication of data for the avian influenza A(H7N9) virus's 3rd outbreak - choosing to release bulk updates and little to no detail on who, where or when. 

The continuing avian influenza A(H5N1) virus outbreak in Egypt is also a mystery to all but a very few. Something that is a concern I think, for a much larger number.

Data from the Ebola virus hotzone countries in western Africa has also had many ups and downs. This is not at all surprising given the conditions, the extent of mobile communications, the history of the region, the political and social issues, the poor health infrastructure and the speed with which Ebola virus disease (EVD) spread through Guinea, Liberia and Sierra Leone in 2014. Many different patterns have emerged over the past year among these numbers. 

One pattern is the "heartbeat" of EVD cases - the difference in number between update and summary tallies - seen when plotting the data reported by the World Health Organization.


Click on image to enlarge.
The peaks (Wednesdays and Mondays) and troughs in this chart both hide and reveal all sorts of tales. Principal among these is that the pulse is slowing. The life of the EVD epidemic monster is steadily draining away as the courageous aid workers in western Africa, those from within and from outside each afflicted nation, track the monster to its every hideout and starve it of its avenues for escape and further spread. 

It is perhaps the slowest and most painstaking of the phases of this epidemic, but the process still moves forward towards the goal of zero cases and the complete eradication of these particular variants of Zaire ebolavirus, from the planet.

The numbers are underestimates...

Ebola virus numbers.

Sorry but D'uh - yes the numbers during the Ebola virus disease (EVD) outbreak happening since December in Guinea then progressing to Sierra Leone, Liberia, Nigeria and Senegal....are an underestimate. 

Of course they are! 

How could they possibly not be?

Have you not watched a single documentary or news video detailing how heartbreakingly difficult it is to visit and help the people of West Africa, to characterize and gather those case numbers, to take, transport and test samples?

The suspect cases are an underestimate. 
The probable cases are an under-estimate. 
The fatal cases are an under-estimate. 

The only thing that is spot on is the laboratory confirmation numbers, because they are what they were when someone wrote them down having had some semblance of control over the steps to acquire them. 

But let's put that underestimation into context. 

"The tip of the iceberg"
Image originally provided by Gregory Haertl, WHO.
Click to enlarge
Influenza case numbers each year are also an under-estimate. 

In fact, some of those, the subtyping numbers, are deliberately so because it's too expensive and wasteful to subtype every single laboratory confirmed case - so a sample of cases are tested and that is assumed to reflect the subtype distribution for that region during that period. 

But seasonal influenza case numbers as a whole are a huge underestimate. Influenza does not drive everyone to a general practitioner nor to a hospital. Some infections with influenza virus don't even produce noticeable symptoms at all. They are still infections. They just don't get counted. So influenza A virus, possibly the most tracked of any respiratory virus, is underestimates. And that's okay. 

Well, measles too, in the respiratory virus department. 

The latest big bad is the species D enterovirus 68 (EV-D68). But the paltry few detections of it (identified by genotyping) that have reported across the United States are likely a monstrous underestimate. In fact we have very little idea of a normal denominator for EV-D68 detections so it's hard to even know if 2014 is seeing all that big a change in its spread and distribution. Usually the enteroviruses (includes rhinoviruses) cause common cold-like illnesses and only get sought out in the great detail from a research point of view.

Middle East respiratory syndrome coronavirus (MERS-CoV) cases or the emerging influenza A(H7N9) virus cases are all underestimated as well. 

The population of your state or country is an underestimate too you know?

This is because we cannot capture every single case of infection, or person, at once. 

So the next time you are about to say "the WHO numbers are an underestimate" as if that is a revelation or an unexpectedly horrible thing you can also lay at their doorstep - please just don't. It's not smart, new or unusual.

You might as well say the world is round; underestimation of infection numbers is just that well established a fact. It's just by how much, and frankly that doesn't even matter too much because the trends can usually be easily seen, or quickly extrapolated.

Perhaps you did not know all that before. But if you have read to here, you do now.

To the Saudi Arabian Ministry of Health: A request for missing data on retrospective MERS-CoV detections

From: Ian M Mackay

To: The Office of the Minister of Health, Kingdom of Saudi Arabia

I write to humbly ask for your help on a matter of infectious disease communication. I ask that you please consider completing the already near-complete public data picture for all retrospectively confirmed cases of Middle East respiratory syndrome coronavirus (MERS-CoV) that have occurred on your soil. I ask that this be publicly released for analysis, and suitably acceptable citation, by all. The Ministry of Health has already made a number of advances in tracking and communicating new cases of MERS-CoV, addressing criticisms along the way. But there remain some small but epidemiolgically important gaps in an otherwise complete set of data that could be easily closed.

Today, the 19th of September, I make note of the Command and Control Center announcement of the discovery of 19 MERS-CoV cases, identified after retrospective analysis of cases.[1] This adds to the 113 MERS-CoV detections announced 3rd June 2014.[2] I also note the reference to removal of a duplicate case and two false positive cases. In addition to these items, there have been many identified deaths that cannot be linked to publicly announced cases because key date data are no longer published along with the time of death announcements, as they once were (see example [3]).

So I ask if it is possible for you to publish a minimum set of deidentified details from cases that have not been fully described by the World Health Organization Disease Outbreak News reports. I suggest an open access spreadsheet on the CCC website.  I do not ask that any compromising or identifying data be included nor do I believe there is a need for identification of hospital or treatment facility. I would be happy to help identify these cases if that could be of use. 

These data include:

  • Age
  • Sex
  • Date when symptoms began
  • Date of hospital admission
  • Date when a fatal case was first reported (allowing a link to be made)
  • City where case likely acquired

The Command and Control Center website and its updates on contemporary MERS cases have evolved into an essential global asset for many international researchers and for the global public, each of whom are still trying to understand this emerging virus. What I suggest here would add even more reach and value to your efforts to keep us all informed. 

As the custodian of over 90% of MERS case data, the world wholly relies upon your transparency, good will, expertise and willingness to openly share it. I believe a complete set of MERS-CoV data have great potential to engage more researchers from around the globe. These links may help identify new and interesting patterns that could be of use to Saudi Arabia and other Middle East and African nations trying to improve control of MERS-CoV now and in the future.

Thank you for reading this.

Yours sincerely,

Ian M. Mackay, Ph.D.
Virologist
Science communicator
ian.mackay.im (at) gmail.com


NB. A response was received and is posted here [4]
  1. http://www.moh.gov.sa/en/CCC/PressReleases/Pages/Statistics-2014-09-18-002.aspx
  2. http://www.moh.gov.sa/en/CCC/PressReleases/Pages/mediastatement-2014-06-03-001.aspx
  3. http://www.moh.gov.sa/en/CCC/PressReleases/Pages/mediastatement-2014-05-24-001.aspx
  4. http://newsmedicalnet.blogspot.com.au/2014/09/mers-cov-data-request-response-from.html

Ebola virus disease (EVD) cases, clusters and outbreaks mapped out...

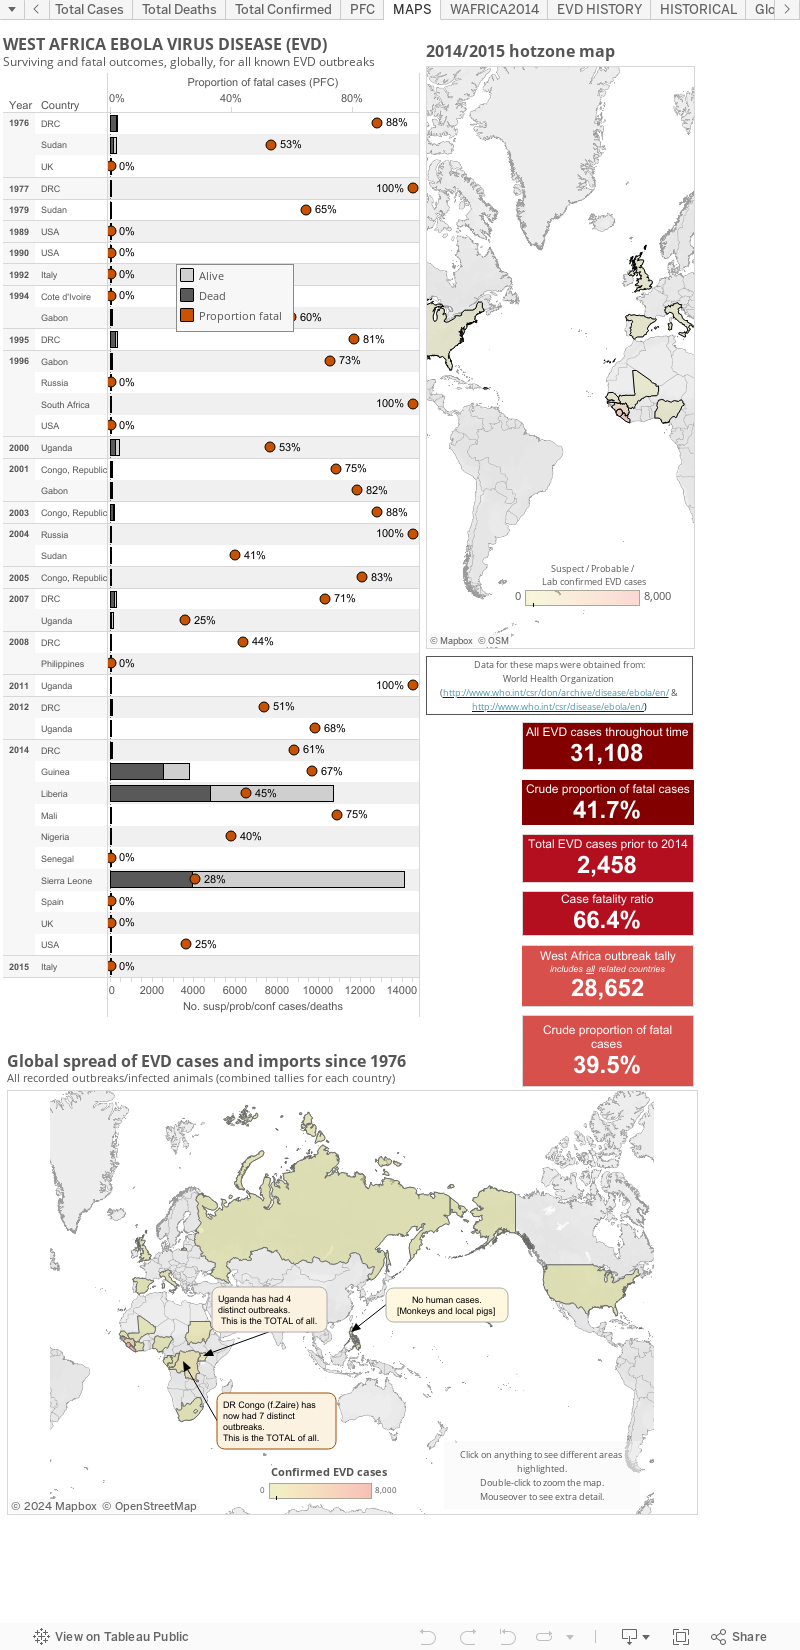
The West African region epidemic (top map), including countries with imported cases and the totals from past Ebola virus disease outbreaks and the few imported monkey cases (the US & Philippines [hence zero human cases]) plotted by total numbers and country (bottom map).

These maps are best viewed alongside my Ebola virus disease numbers page found here.


The WHO create multi-page Situation Reports [2] and brief Situation Summaries.[3] They are currently presented on Wednesday and "additional updated figures" will be posted "as they become available any day of the week" (via eMail to journalists from WHO).

My totals include all countries that have hosted a case in, or sourced from, a West African nation. Countries include Guinea, Liberia, Sierra Leone, Nigeria (now EVD-free), Senegal (now EVD-free), the United States of America, Spain and Mali.

This is a static page but as of 21-Jan-2015 (AEST) I have copied the maps to the bottom of my main EVD EBOV|Makona (west African Zaire ebolavirus variant) outbreak page at:  http://newsmedicalnet.blogspot.com.au/2014/07/ebola-virus-disease-evd-2014-west.html


A note about the proportion of fatal cases (PFC): 
On these graphs, my PFC calculations for West African countries and the DRC are based on dividing the total number of suspect/probable/confirmed deaths by the number of total suspect/probable/confirmed cases for the same date. This is crude and may be a sizable underestimate of the true PFC.

It may be better to use the deaths at the most recent date divided by the total cases from 9-16-days  earlier (this number is not precisely known) to better account for the lag in time between presenting to a treatment facility and dying (for those who do not recover). 


Some estimates suggest the true PFC may be closer to 70%-80%. I don't have enough data (or smarts) to be able to calculate the lag for now so please be aware that the PFC above is likely an underestimate.


  • The figure above, as with all on VDU, is made for general interest only. It is also freely available for anyone's use, just cite the page and me (Dr. Ian M Mackay, PhD) please. It may be that I have misinterpreted the language in the reports (sometimes a little tricky to wade through) or miscalculated some totals based on the way data have been presented. 
  • Sometimes there are very country-specific differences in what gets presented to/via the World WHO DONs/SitReps which make this process less clear than it could be. I recommend you have a read and compare the data from each of the countries for yourself to understand these issues. 
  • As I've talked about previously,[1] these numbers are all volatile for a variety of reasons, some Ebola-specific, so regard this chart for its trends only.
  • I am only able to plot what is publicly available. To date, this does not include granular data with dates of onset, or daily data of any kind. The WHO have these data and you will see them become more available through their Situation Reports found here http://www.who.int/csr/disease/ebola/situation-reports/en/
References... 
  1. Ebola virus disease and lab testing...
    http://newsmedicalnet.blogspot.com.au/2014/04/ebola-virus-disease-and-lab-testing.html
  2. Ebola virus disease outbreak Situation Reports (SitRep)
    http://www.who.int/csr/disease/ebola/situation-reports/en/
  3. Ebola virus disease outbreak Situation Summaries (SitSumm)
    http://apps.who.int/gho/data/view.ebola-sitrep.ebola-summary-latest?lang=en

Like Us

Blog Archive