Medical News Blog Information

Where has all the MERS-CoV action been...?

Sorry but no prizes to be awarded here.

...the Kingdom of Saudi Arabia is where nearly 90% of all laboratory-confirmed detections of the Middle East respiratory syndrome coronavirus (MERS-CoV) have originated from, as best we can tell. 

This is based on data sourced from the World Health Organization, various Ministries of Health around the world, FluTrackers and the scientific literature. All public data sources. 

While the tally sits around 847 cases and 291 deaths, right now we are experiencing a multi-week lull in new case announcements. Great news for the region and the world, which is dealing with many assaults, biological and otherwise, right now.

Where the wild MERS-CoVs are.
Click on chart to enlarge.

Ebola West Africa numbers in context...[AMENDED]

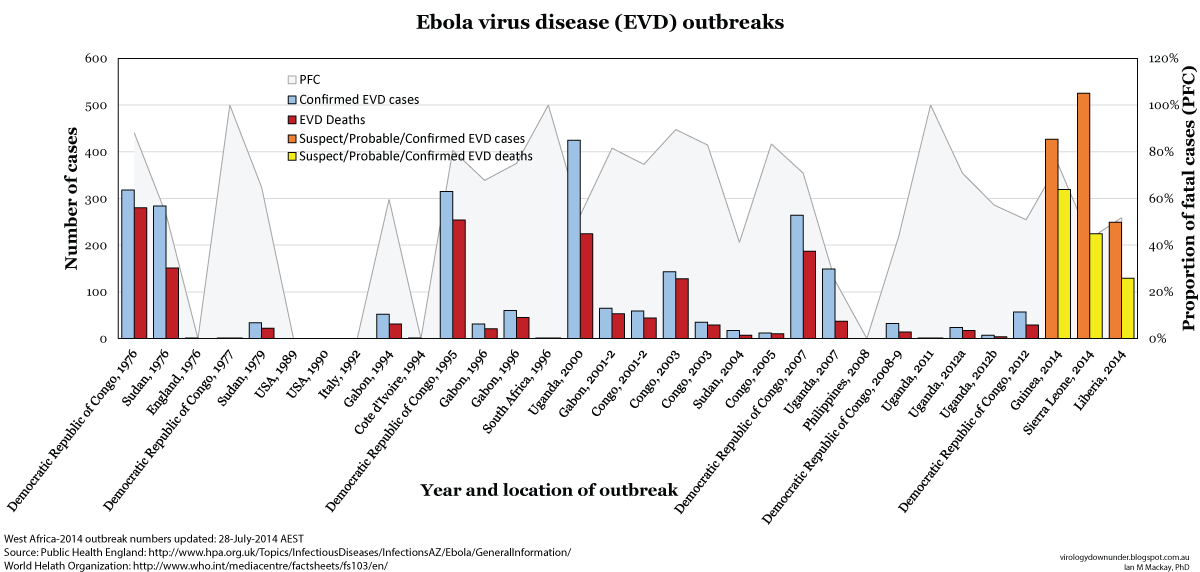
A quick glance at how the suspect, probable and laboratory confirmed (susp/prob/conf) cases of Ebola virus disease (EVD) stack up in the 3 countries with local spread of Zaire ebolavirus.

Please note that I have separated Guinea-2014, Sierra Leone-2014 and Liberia 2014 only to highlight that each country in the single "West Africa" outbreak (involving a single viral variant as far as we know) has greater case numbers than those found in many of the earlier outbreaks.

I have not yet listed the case imported to Nigeria here.

Click on chart to enlarge.

Now for something (not so) completely different: H7N9 maps...

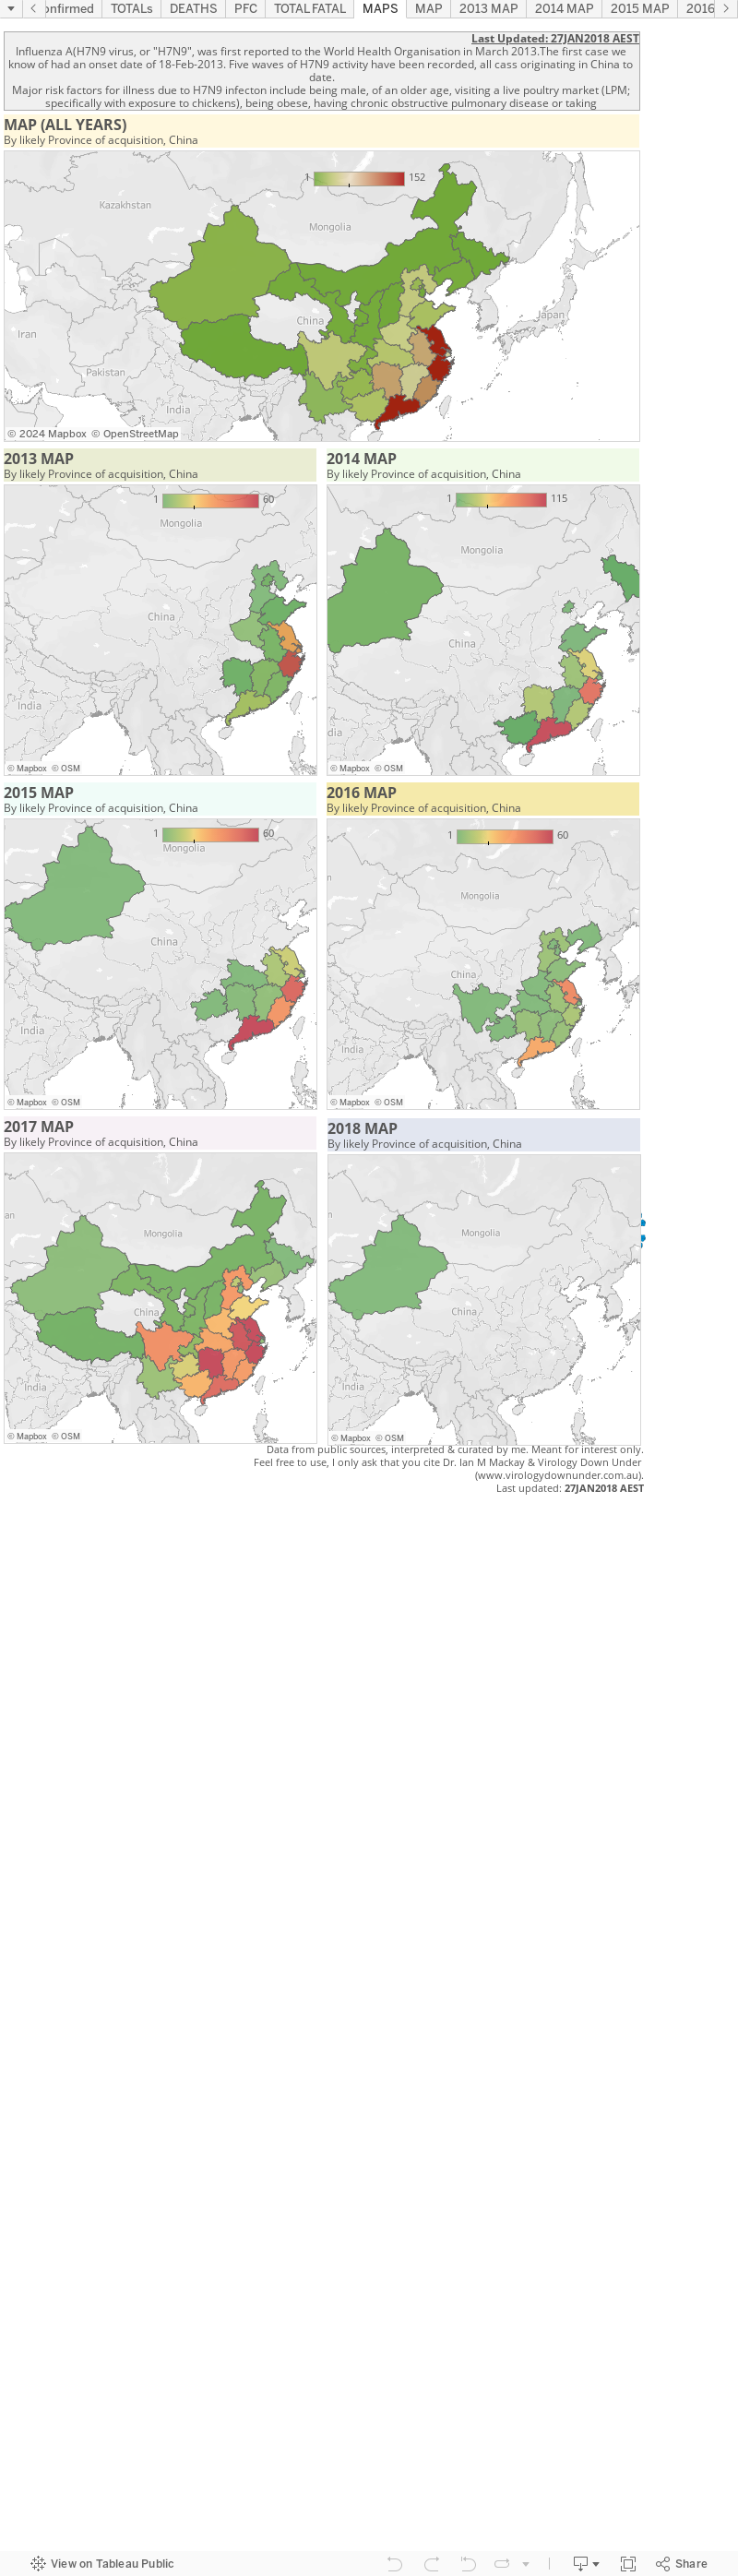
Now it's time to mess around with influenza A(H7N9) virus mapping using Tableau.

I've (only just) realised the my esteemed peer, Shane Granger has been using Tableau to do this for ages (see here), and that this will be duplicating his excellent work. So I'll try my best to consciously differentiate my maps from his - but there's only so far you can go with that and there will be overlap. 

The page below is a very early first play with H7N9. It's just detections broken across 2013 and 2014, by province most likely to have been the source of the infections (as far as I can tell) in mainland China. 

If I can master this I'll try and add more details in the future. For now, these numbers a a little out of date but he trends are similar. This charts 449/452 detections.


Middle East respiratory syndrome coronavirus (MERS-CoV): Age and Sex [UPDATED]

THIS PAGE IS NO LONGER UPDATED

This data visualization has been added to the single
MERS-CoV page now be found at..
http://newsmedicalnet.blogspot.com.au/2014/07/middle-east-respiratory-syndrome_17.html

A new static page on which I will update the MERS-CoV numbers as they relate to the age and sex of the people laboratory confirmed as infected.


Middle East respiratory syndrome coronavirus (MERS-CoV) by week and month...

To follow up yesterday's daily numbers chart, here we have the number of MERS-CoV detections by week (Chart 1) and by month (Chart 2). 

Not a lot of change from my last posts of these 18-June and 23-June - we are currently in our 5th straight day without any new detections being reported - and prior to this drought, there had been very few other detections for a while so we can now very clearly see the Jeddah-2014 (Kingdom of Saudi Arabia) major hospital-base outbreak peak's beginning and end.

We're also in the second half of Ramadan, putting us past the maximum likely incubation period for those visitors to the holy places that may have acquired MERS-CoV infection at the beginning go the month. A pretty good indication that MERS-CoV is not spreading among the community. It is still strange to me that a region that was yielding sporadic cases up until very recently, is now not yielding any such cases. Perhaps it's the improvements initiated under Dr Fakeih's watch, or maybe the hot, dry weather? It could be that camel contacts are reduced or that festivals are not as frequent in the extreme heat.  It would be great to see some scientific literature emerge on the Jeddah-2104 outbreak, on seroprevalence, on camel testing, gene/genome sequencing, studies of other animals or transmission investigations. Things have been very quiet on the publication front for some time now and we still know very little detail about the largest flurry of (known) cases to have occurred since 2012.

We'll wait and watch and see, I suppose.

MERS-CoV detections, worldwide (but mostly in the Kingdom of Saudi Arabia), by week.
Click on chart to enlarge.


MERS-CoV detections, worldwide (but mostly in the Kingdom of Saudi Arabia), by month.
Note the yellow star which highlights a 10-fold higher scale for 2014 y-axis (left-hand side) than in the 2013 numbers. Even 2014's puny June surpassed any month in 2013.
Click on chart to enlarge.

Middle East respiratory syndrome coronavirus (MERS-CoV) daily numbers...

Because I miss my charts, this is a quick one, made the old fashioned way (Excel and Adobe Illustrator).
MERS-CoV detections by date of illness onset (orange; when available, otherwise date of hospitalization or reporting) or by reporting date only (blue), each day since 22-March-2014. 
Click on image to enlarge.
A few things to note from this chart:

  • I've arbitrarily chosen to bracket the Jeddah-2014 outbreak as starting in the week beginning 17-March-2014 (MERS Week #106) and ending in the week beginning 19-May-2014 (MERS Week #114). There don't seem to be Jeddah-originating cases in the week after that, and case numbers are low (<5/day, similar to the same period in 2013) from then onwards...although this is not an exact science. For example, does one count those cases from the Al Qunfudah cluster that were moved to Jeddah hospitals? But it's a guide.
  • This chart has the daily case numbers (orange) based mostly on the date of illness onset. This highlights (again) the ongoing paucity of recent MERS-CoV detections which is great news for the Kingdom of Saudi Arabia (KSA). The map below previously posted here, does highlight an interesting questions. How are the small number of cases reported in June/July so widespread and where are the infections being acquired from? It's not spring (the camel calving hypothesis suggests human cases take off during the active birthing period; perhaps this is just the "ticking over", non-Spring norm for animal>>human acquisitions?) and there are no hospital outbreaks. Is this community spread? All the indicators we have point away from that. It is also a very busy time in the KSA right now with Ramadan having attracted visitors for some weeks. We have not yet seen cases appearing among those with underlying illness, an indicator or sentinel population for MERS outbreaks because they show the more obvious result of an infection. So these cases must be ongoing sporadic camel (or other animal, including goats which appeared in the recent WHO disease outbreak news) to human acquisition. Right? I'm looking forward to some widespread camel testing results from the KSA and some human seroprevalence studies would be very relevant too. Not sure what's taking so long for the latter to appear.
  • The plot of detection based on date of reporting (blue) is somewhat messed up by the found113 detections for which we have no date breakdown (see here for more detail or search VDU for found113). This means the detection all get assigned into 3-June, the date the KSA Ministry announced them. Yuck. It looks like those details are never going to materialize either. At least, my personal efforts to get date data from Prof Tariq Madani have failed, despite his public assurance that more detailed data could be made available to scientists who wanted it, and the WHO seem to have moved on to posting more contemporary cases in detail, skipping over the same level of detail for the found113.
The very good news is that Ramadan has not coughed up a plague of new MERS cases. The bad news is, we still don't really know the source of the cases that have been continuing to emerge in the KSA. Without knowing that we really don't have a handle on this disease, or this virus, at all.

Location of June/July MERS-CoV detections in the KSA.
Click on map to enlarge.

Like Us

Blog Archive